本帖最后由 大喵先生 于 2022-2-9 22:39 编辑
ServerStatus - 改用vnstat统计流量汇总信息
修改版源码地址:https://github.com/nzzaidi/ServerStatus
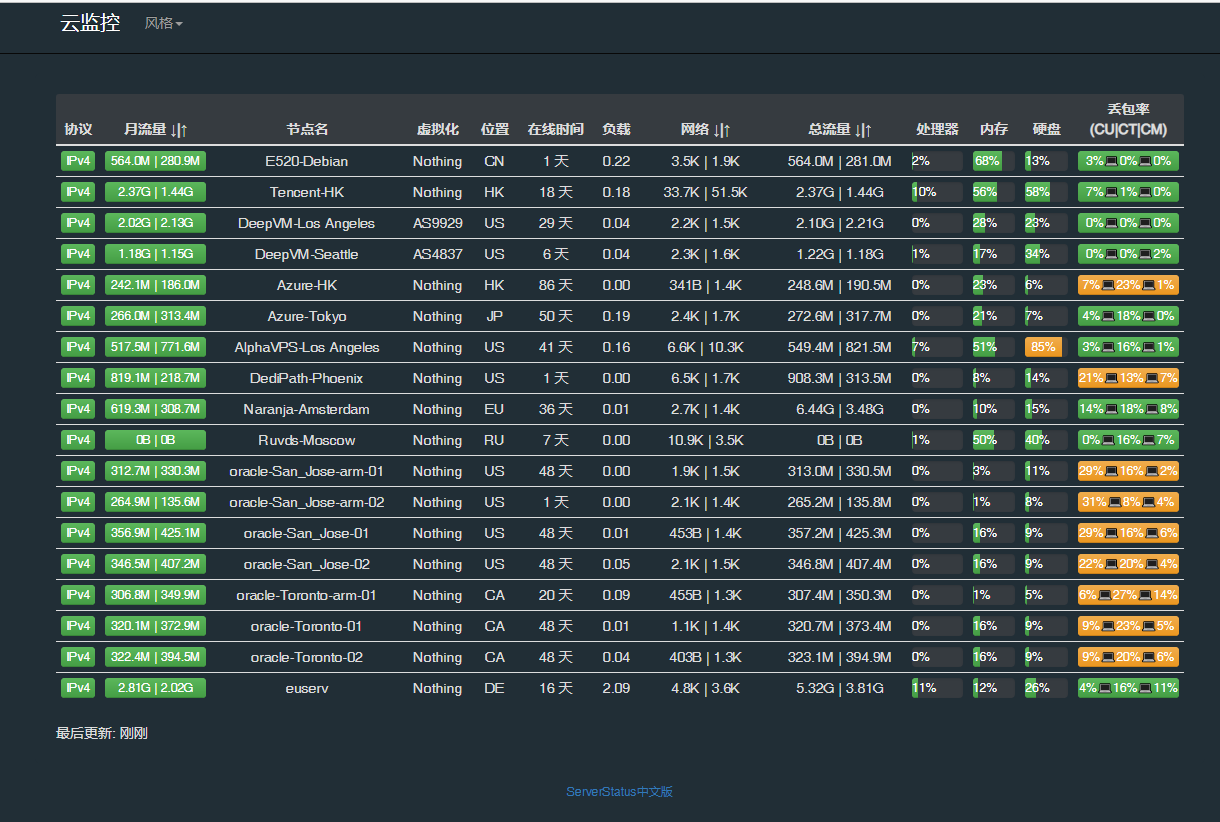
演示地址: https://tz.222280.xyz/ , 欢迎以针会友.
个人比较喜欢 https://github.com/cppla/ServerStatus 大佬探针的三网ping小功能,看到有mjj对流量汇总信息累计数据的持久化有需求,就参考了几位大佬们的大佬,结合优化了一下。PR就不提交了 , 原版已经很优秀且足够轻量了.
参考 https://github.com/P3TERX/ServerStatus-V 中 vnstat 统计流量的实现方式,
在 https://github.com/cppla/ServerStatus 的基础上,优化和更新:
- 改用vnstat统计流量累计汇总信息
- 优化了前端更新时间的显示
- 优化了月流量和总流量信息的显示
探针服务端和客户端的安装教程请参考原版.
使用此版本时注意,需手动安装 vnstat ,如未安装则流量数据不会显示。具体教程请参考:
vnStat 安装教程 https://p3terx.com/archives/statistics-vps-traffic-using-vnstat-under-linux.html
另外,vnstat 默认以 比特单位 显示, 通过运行以下命令修改/etc/vnstat.conf中的 UnitMode,RateUnit 配置项,以实现 字节单位 显示:
- # how units are prefixed when traffic is shown
- # 0 = IEC standard prefixes (KiB/MiB/GiB...)
- # 1 = old style binary prefixes (KB/MB/GB...)
- # 2 = SI decimal prefixes (kB/MB/GB...)
- sed -i "s/UnitMode.*/UnitMode 1/g" /etc/vnstat.conf
- # used rate unit (0 = bytes, 1 = bits)
- sed -i "s/RateUnit.*/RateUnit 0/g" /etc/vnstat.conf
另外补充,https://github.com/cokemine/ServerStatus-Hotaru 和 https://github.com/cokemine/nodestatus 这俩探针可以自定义是否选择vnstat计算流量,大家按照喜好自由选择即可。 |
 [复制链接]


 发表于 2022-2-9 21:47:19
 楼主
楼主